
![]() Estimated Read Time: 4 Minutes
Estimated Read Time: 4 Minutes
Sections in this article:
- Performance Quadrant
- How the Score is Calculated
- Vendor Scorecard Dashboard
- CSV Export
- Data Table View
- Vendor List
Once a scorecard survey has closed, you can view the data collected in various places throughout Gatekeeper. The sections below outline the ways that you can monitor your vendors' scorecard performance.
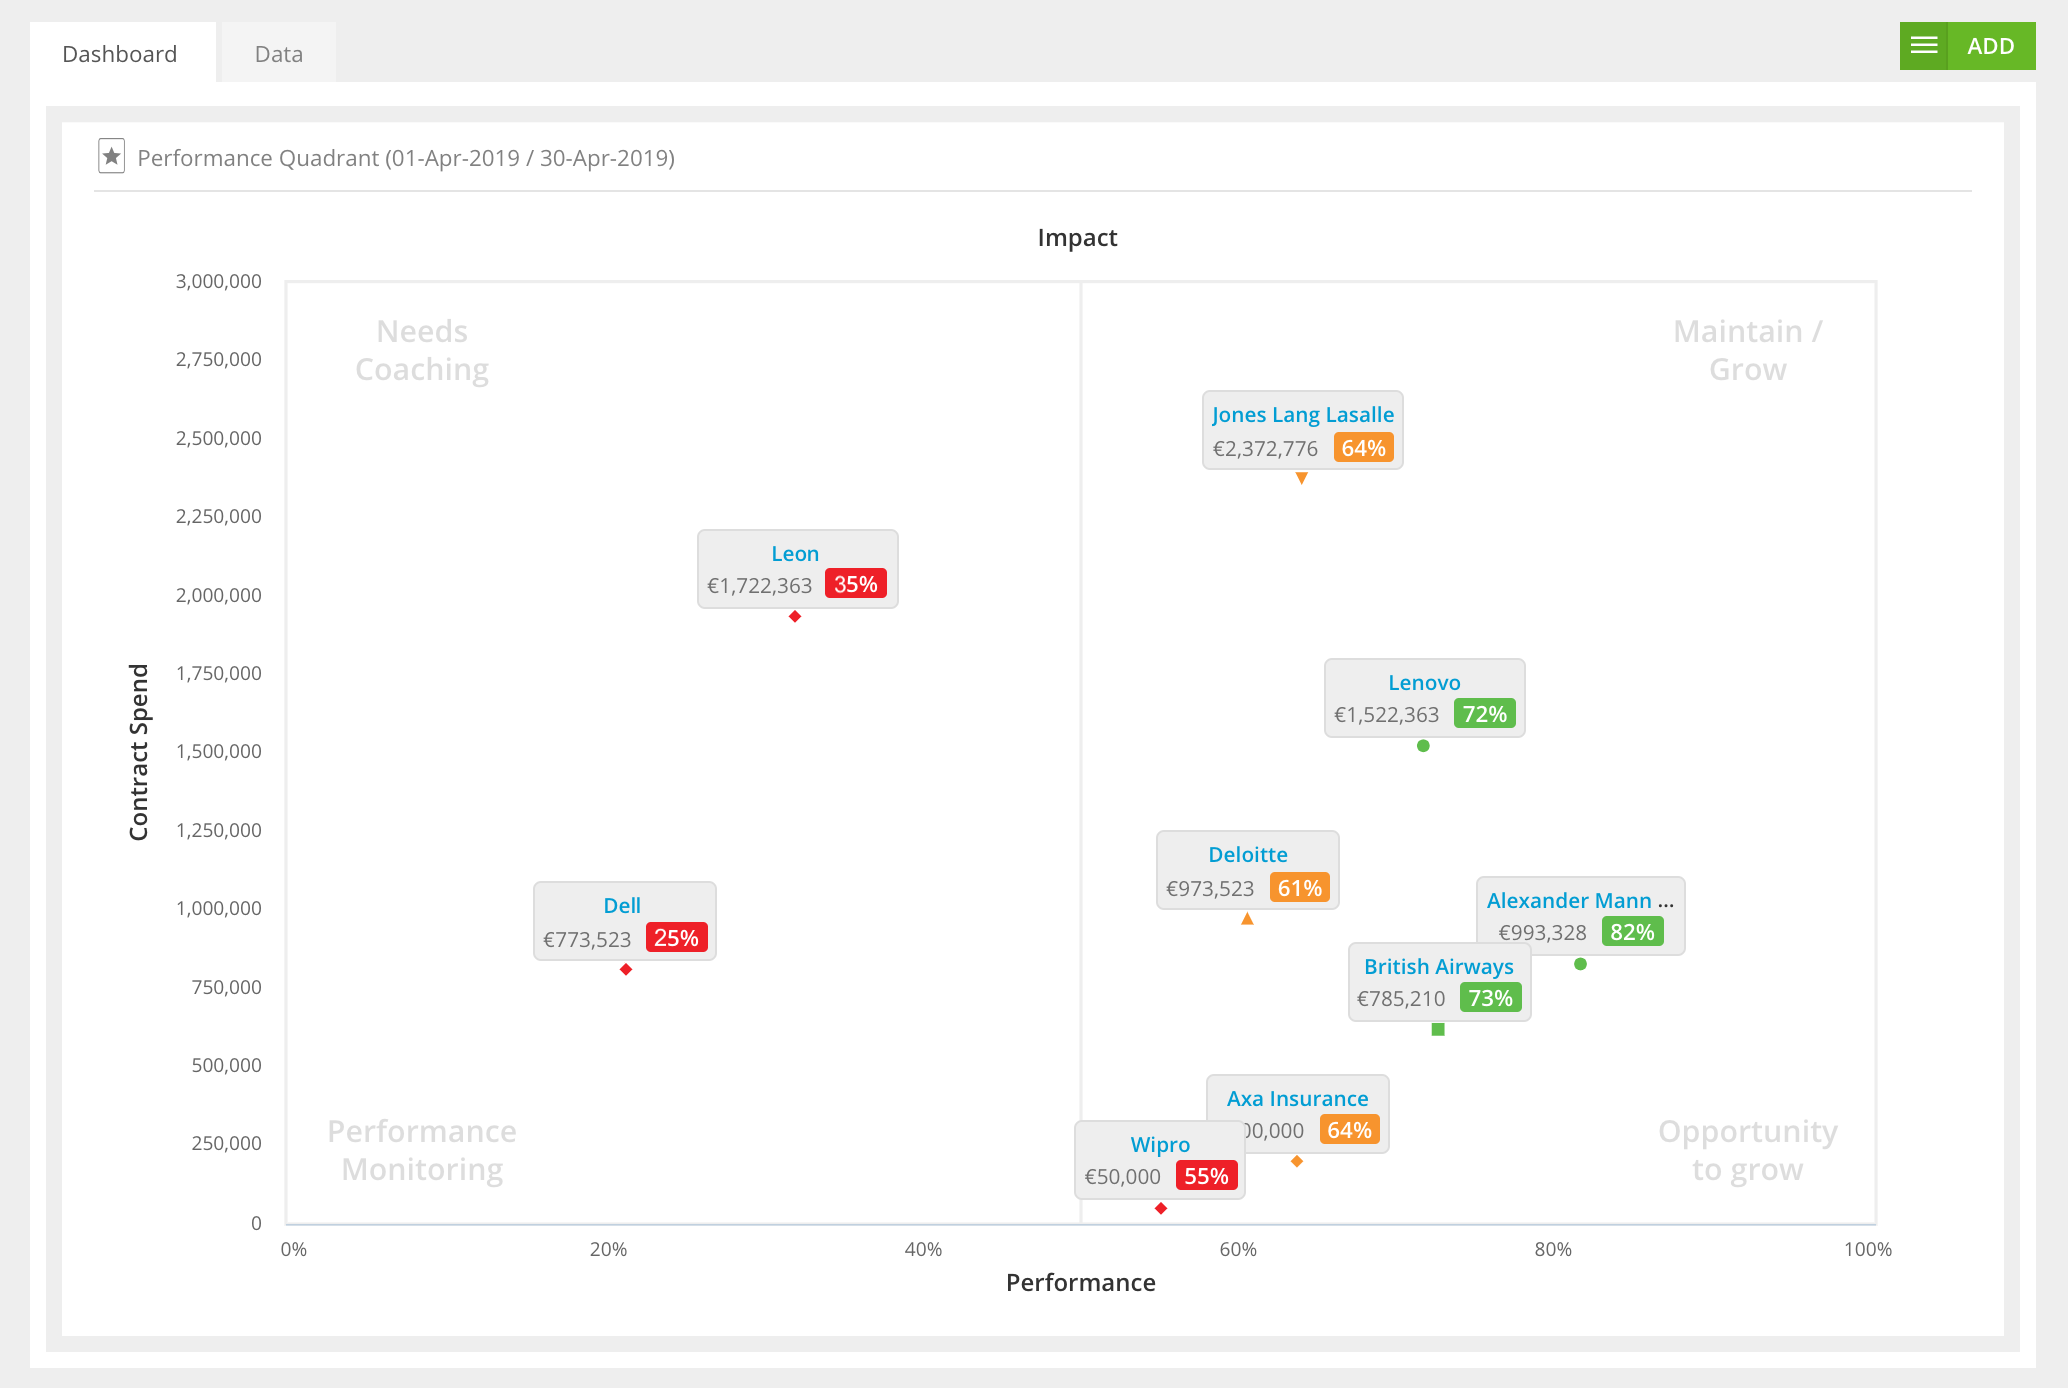
Performance Quadrant
This quadrant displays the results from the most recent survey time period for a specific scorecard. It charts the vendors based on their Contract Spend (Y-axis) and their survey performance (X-axis).
To view the performance quadrant:
- From the navigation menu, click Scorecards.
- Click on the relevant scorecard and navigate to the Dashboard tab.

How the Gatekeeper Score Is Calculated
Rather than taking the mean of the four dimension scores, Gatekeeper first calculates each reviewer’s weighted total, then reports the median of those five totals. The median is used in order to minimise the impact any one reviewer’s extreme high or low rating. In practice, this means that:
- If someone overrates a dimension, it won’t skew the overall score as much.
- You’ll often see the Gatekeeper score sit 1–3 points below the Calculated Score for Primary Dimension mean.
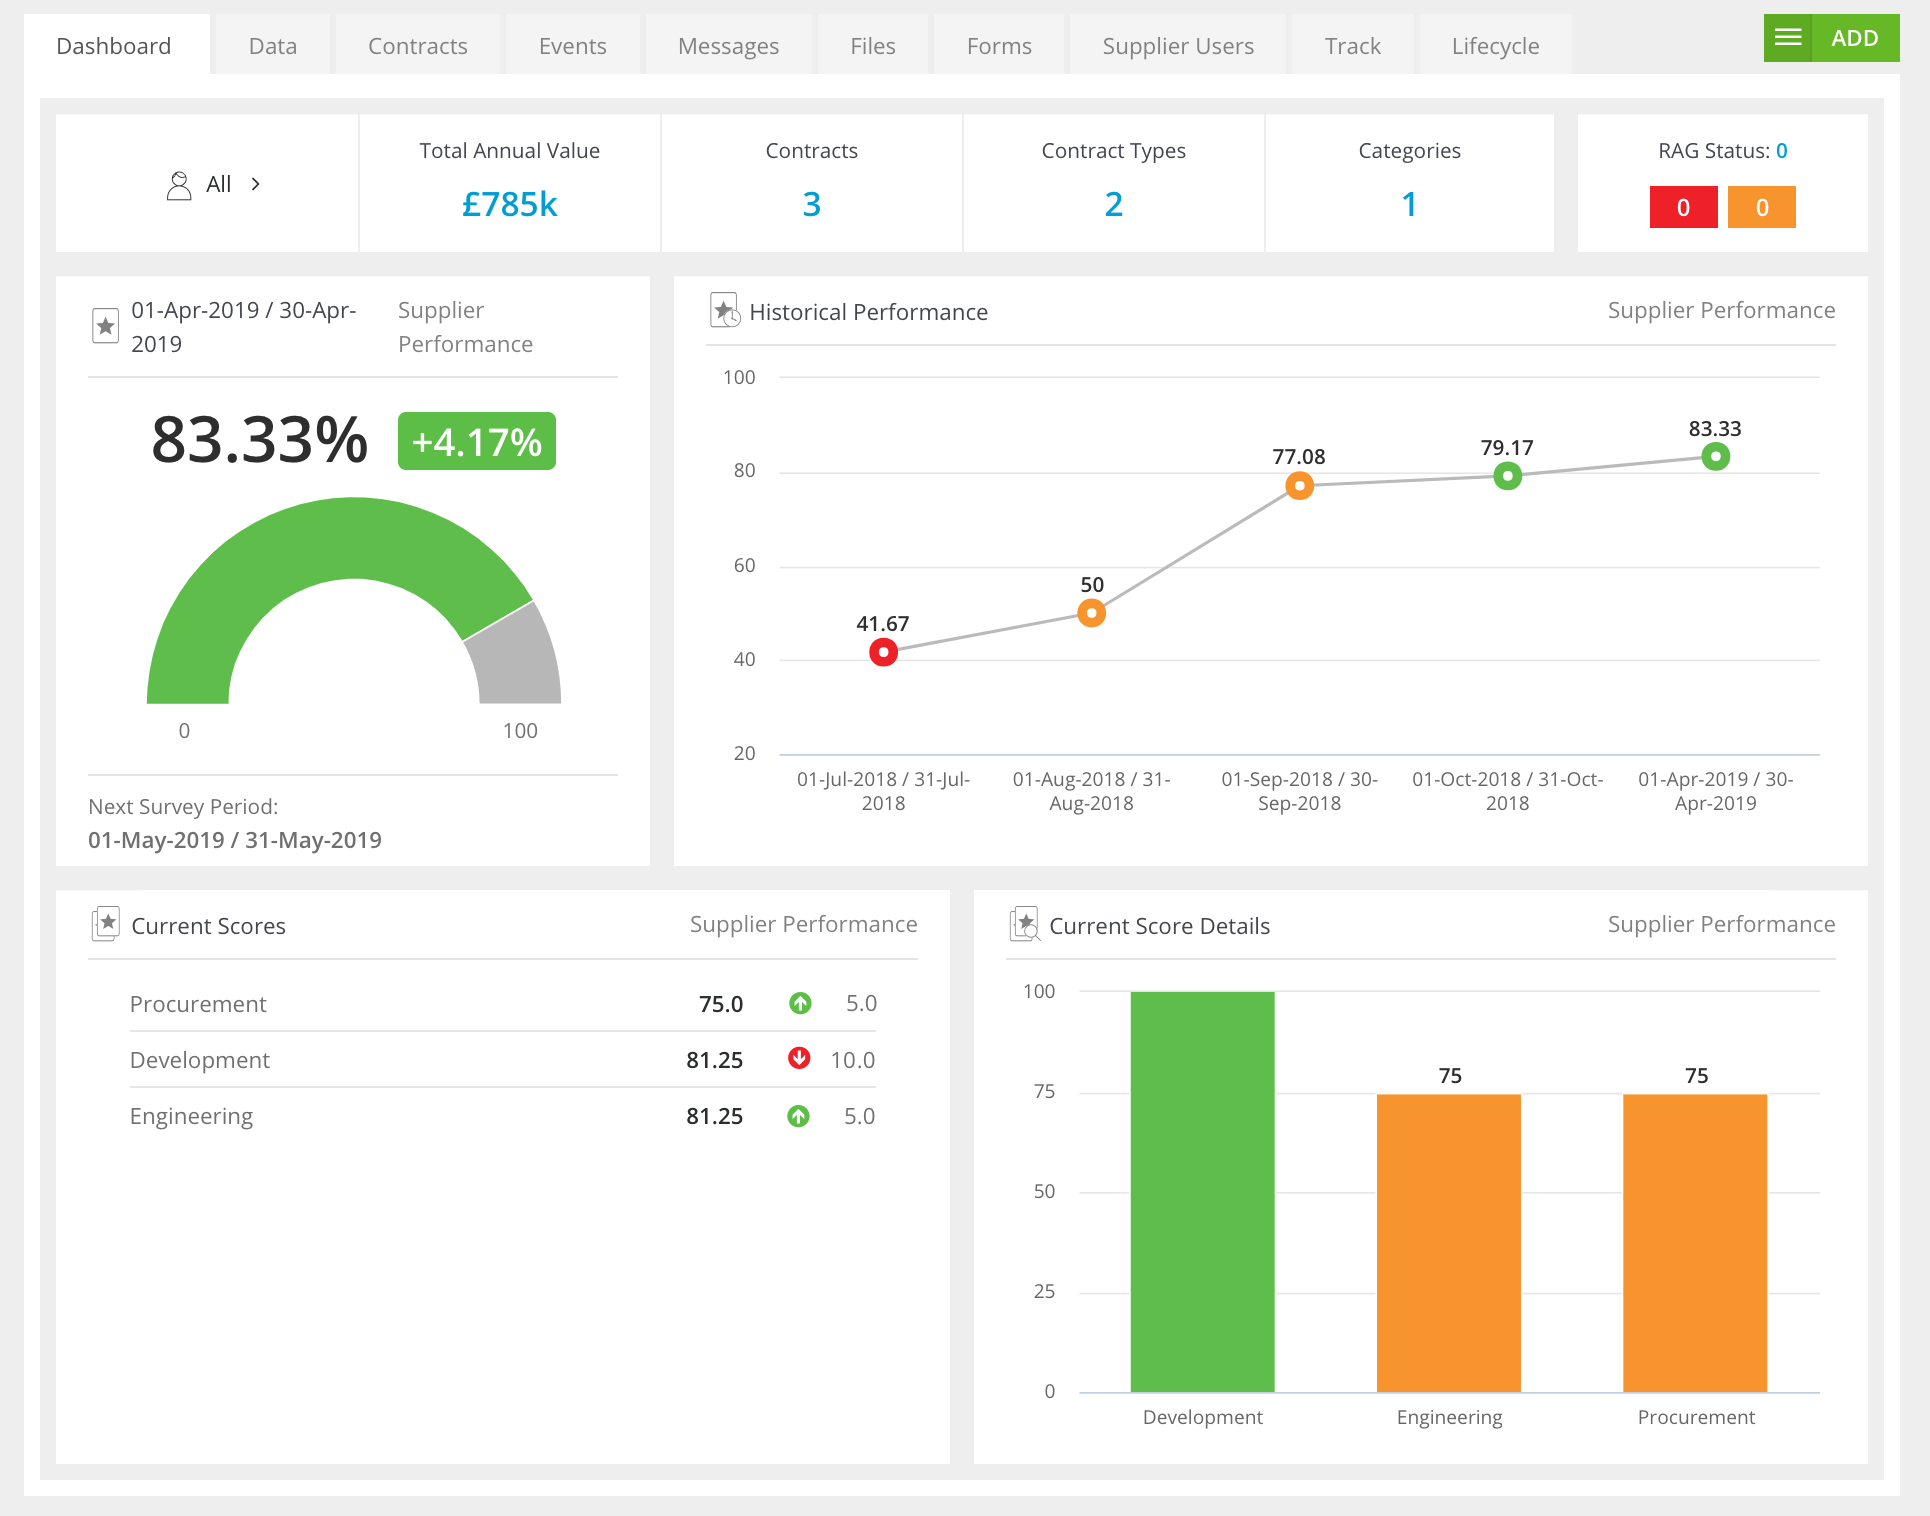
Vendor Scorecard Dashboard
Any vendor that has been included within a closed scorecard will now have a Vendor Dashboard tab added to their record.
To view this:
- From the navigation menu, expand the Vault then click Vendors.
- Search for and click on the name of the relevant vendor.
- Navigate to the Dashboard tab.
This dashboard provides a visual representation of a vendor's:
- Current overall performance
- Full historical performance
- Current performance within the primary dimensions
Note: By default, the scorecard displayed in these widgets is the first in alphabetical order. However, you can change the scorecard for each widget by clicking its name in the top right corner.
CSV Export
You can download a CSV file of historical data collected from all surveys within a scorecard. This allows you to analyse and present the data externally. To do this:
- From the navigation menu, click Scorecards.
- Click on the relevant scorecard and navigate to the Data tab.
- Click Export then select CSV Export.

Note: The CSV export contain the following:
- Survey Period
- Vendor Name and Score
- Primary Dimension Title and Score
- Sub-Dimension Title, Description, Score, User, and User Comment
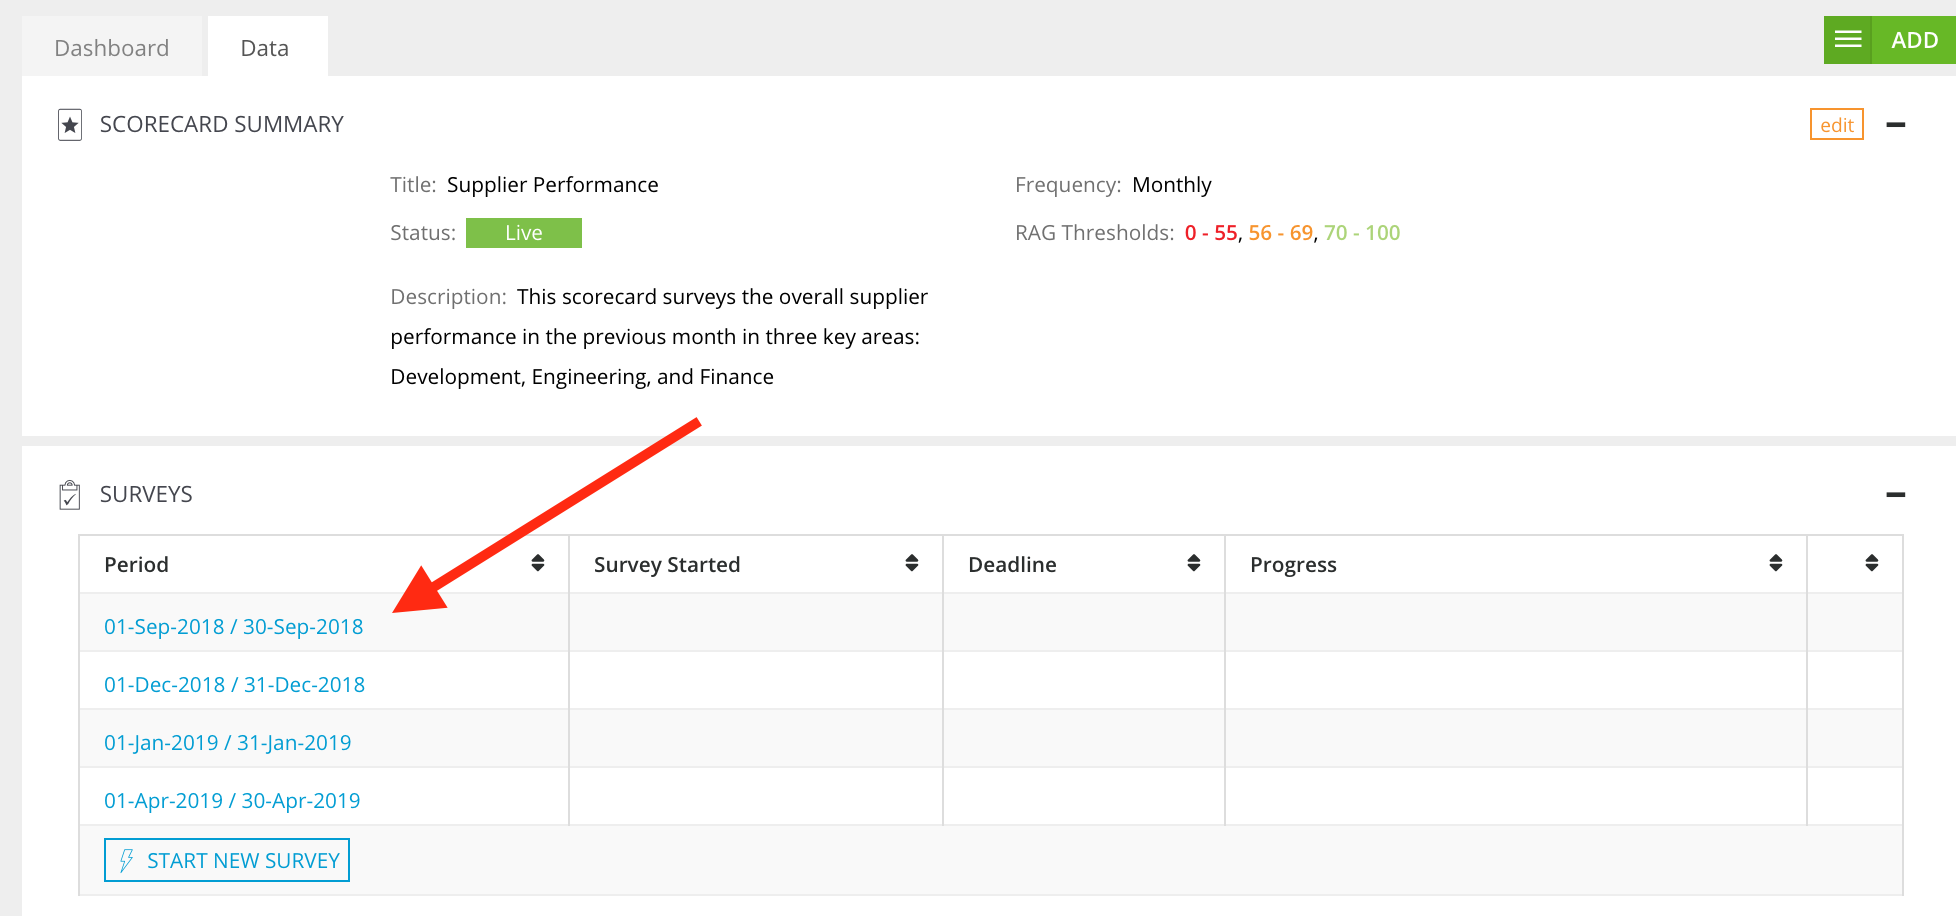
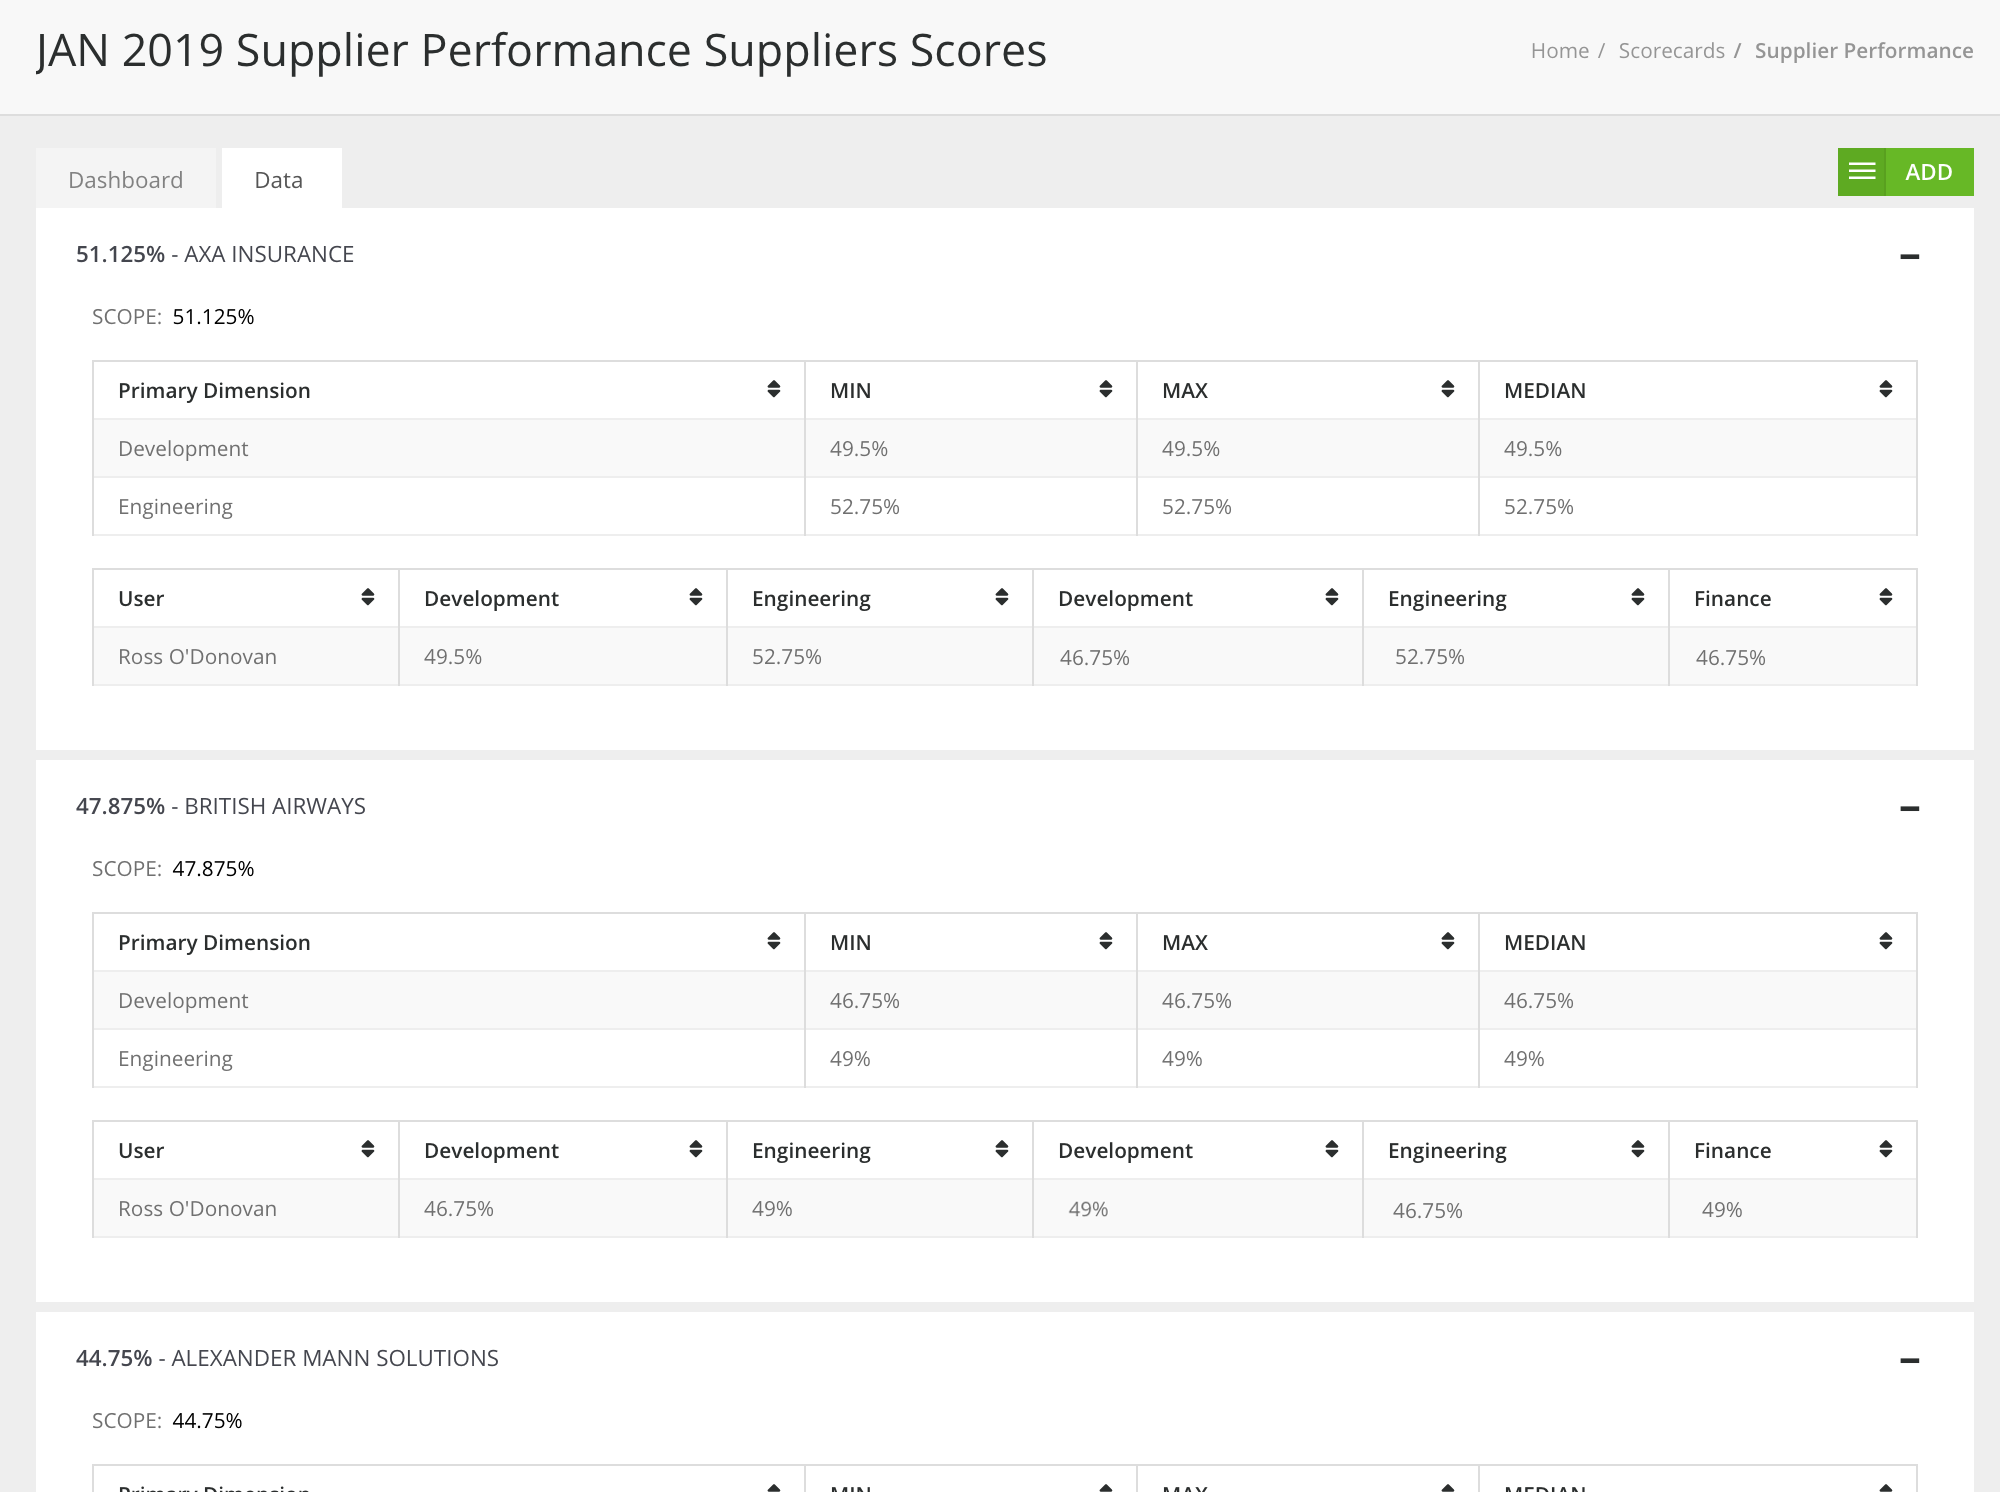
Data Table View
You can view a detailed breakdown of any closed surveys by clicking on the surveys time period from the Data tab:
Vendor List View
You can also configure the vendor list view to display a column that captures the latest scorecard survey. This will show the score from the latest closed survey from the scorecard that is highest alphabetically. For example, if you have more than one scorecard (Scorecard A and Scorecard B) then the score from Scorecard A will appear in the column.
To do this:
- From the navigation menu, expand the Vault then click Vendors.
- Click the Configure Columns icon.
- Select the Vendor Score checkbox then click Save.
For more details on configuring the vendor list view, see Configure Your Vault List Views.