![]() Estimated Read Time: 10 Minutes
Estimated Read Time: 10 Minutes
Sections in this article:
- The Executive Dashboard
- Quarterly Dashboard
- The Risk Dashboard
- The Vendor Portal Dashboard
- The Employee Portal Dashboard
- My Dashboard
- The Spend Dashboard
- eSign Dashboard
- Teams, Categories and Entities Dashboards
- Submit Requests Dashboard
Introduction
Gatekeeper dashboards are designed to transform complex data into actionable insights, offering you a bird's-eye view of your organisation's contract and vendor management landscape.
The sections below detail the out of the box dashboards available within Gatekeeper, however, the settings of a tenant and the permissions of your user profile may affect which of these is available to you. For details on creating your own dashboards, see Custom Dashboards.
Generally:
- Users with the Global permission will be able to access all dashboards available for a tenant
- Users without the Global* permission will only have access to My Dashboard and the Quarterly Dashboard.
*This includes Own Team, Owned Only, and RBAC users.
Filter Data
Within various dashboards, you can filter your data by:
- You Own and All Filter: View data filtered by contracts you own, or all contracts that your permissions grant you access to.
- Date, Workflow, or List View: Filter by date, workflow, or use a list view to tailor your data analysis.
- Cards Filter: You can opt to view all cards, or specifically those with an SLA (Service Level Agreement) associated with them.
- Approvals/Form/eNegotiate/eSigns Filters: Customise your view further by toggling between these filters.
Note: Not all dashboards can be filtered.
Manage Your Dashboards
Users can set a default dashboard on login, and manage which order their dashboards appear in. To do this:
- Click the cog icon next to the dashboard tabs.
- Enable and disable the On toggle to show or hide each dashboard as needed.
- Click and drag the dashboards to reorder them. The dashboard at the top of the list becomes your default landing page when you log in to Gatekeeper.
- Click Save to apply your changes.
The Executive Dashboard
Required Permission - Global Administrator or Global Collaborator
The Executive Dashboard offers users an overview of their Gatekeeper tenant data.
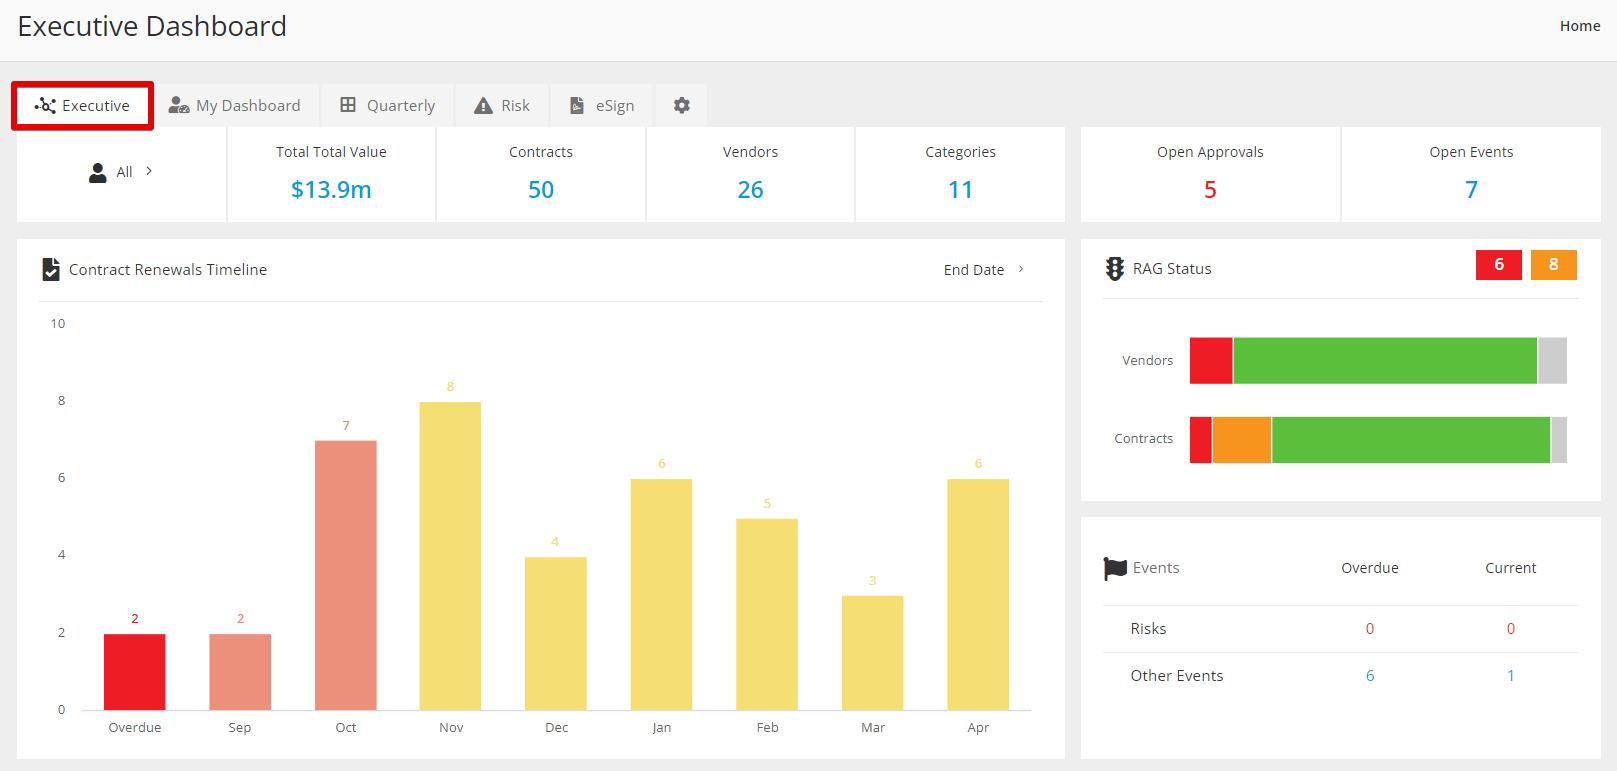
The Contract Renewals Timeline helps ensure no renewal dates slip through the cracks. By default, it tracks Contract End dates, but you can toggle the view to see Notice Period End Dates instead.

You can click on chart elements to drill into the additional data. This displays a report that can be exported to CSV for offline data processing, or to PDF for sharing.
Quarterly Dashboard
Required Permission - N/A (available to all users)
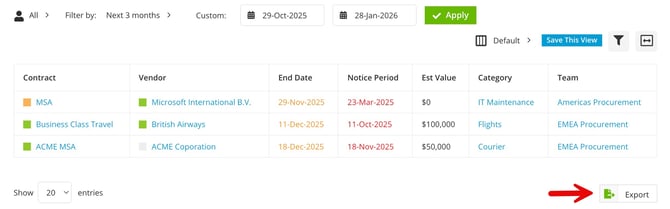
The Quarterly Dashboard focuses on near-term renewals by providing a snapshot of the next 3 months' worth of data.
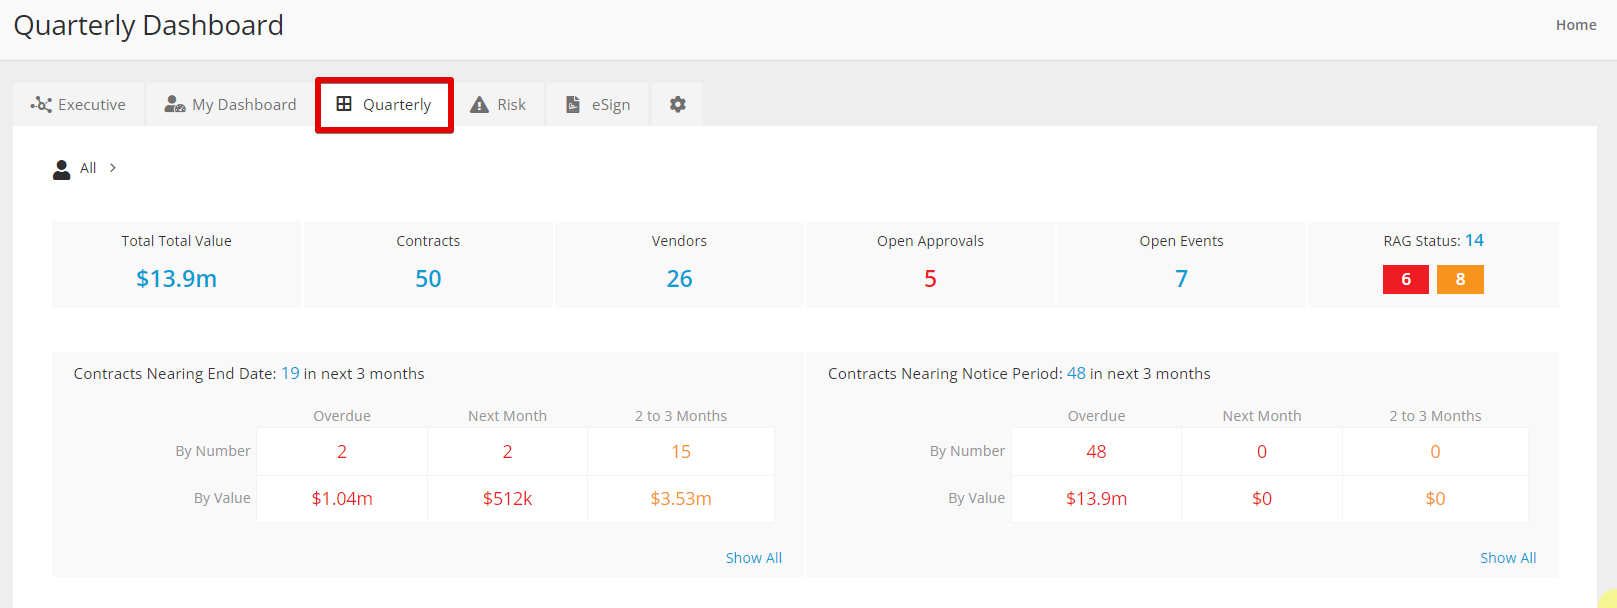
This highlights contracts approaching both their Renewal (End) Date and Termination (Notice Period) Date in the coming three months, plus any events and open approvals.
You can filter by all contracts, vendors and events you have access to in Gatekeeper, or just the ones that you own.
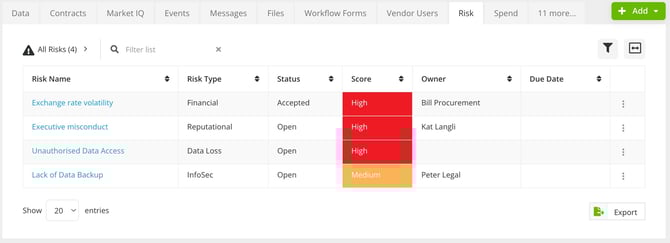
The Risk Dashboard
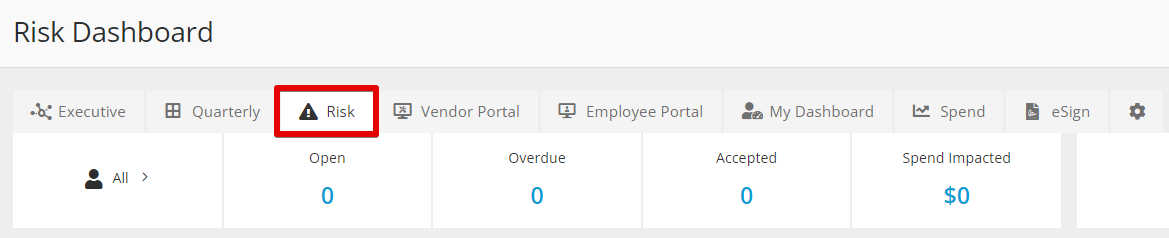
Required Permission - Global Administrator or Global Collaborator
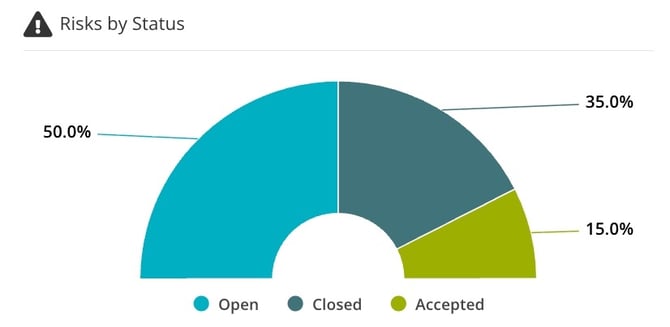
If your organisation uses the Risk Module, the Risk Dashboard provides an overview of risk management using reports and key performance indicators (KPIs).
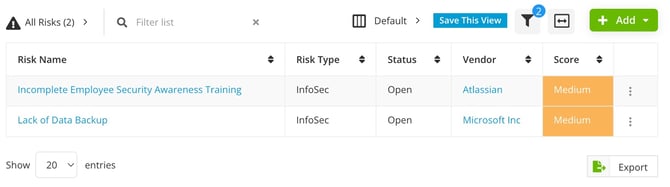
The Risks by Vendor chart displays your top 15 live vendors containing risks, grouping them into colour-coded low, medium, and high categories. These are derived from the probability and impact ratings assigned to each risk.
Note: Gatekeeper selects the top 15 vendors based on the number of open or accepted risks they have.
If you have more than 15 vendors where the lowest-ranked contain an identical number of open/accepted risks, Gatekeeper selects the highest alphabetical vendor name to include in the chart.
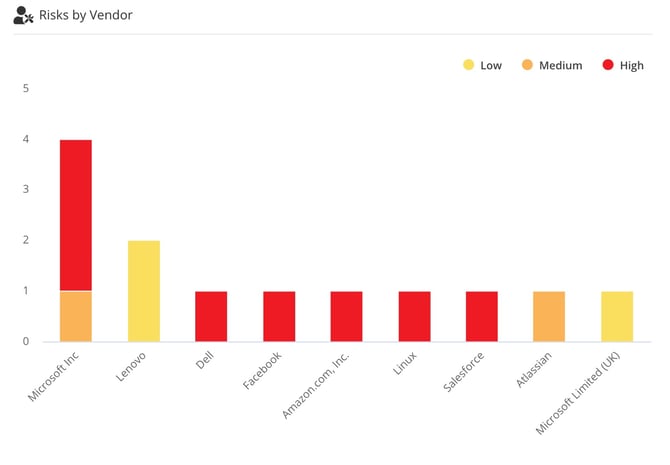
Click on a bar to navigate to the Risk tab of the vendor record, displaying an overview of all associated risks.
The Vendor Portal Dashboard
Required Permission - Vendor Portal Module Administrator

If your organisation uses the Vendor Portal, the Vendor Portal Dashboard provides a comprehensive overview of vendor-related activities and statuses, allowing you to monitor and control the vendor engagement process.
Key features of the Vendor Portal Dashboard include:
-
Vendor Summaries: a summarised list of vendors associated with the portal.
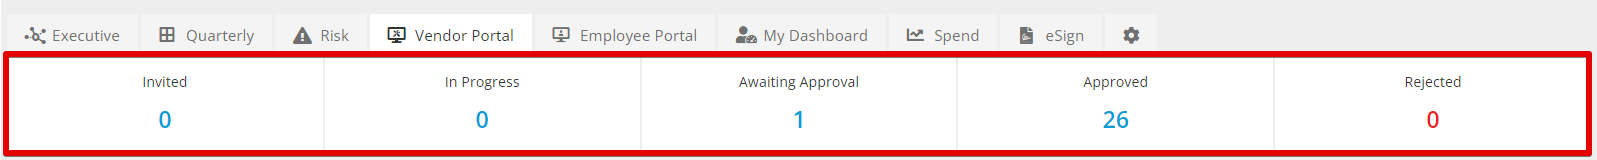
-
Workflow Status: allows you to track the progress of workflows involving vendors. Vendors are categorised based on whether they have an ongoing workflow, are awaiting approval, have been approved, or have been rejected.
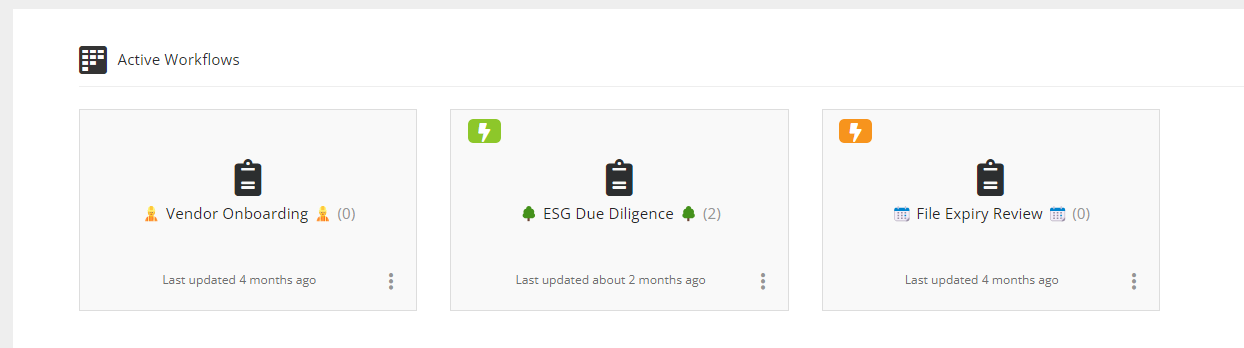
-
Active Workflows: displays active workflows within the user's domain that use the vendor portal. This helps you stay informed about the ongoing vendor-related processes.
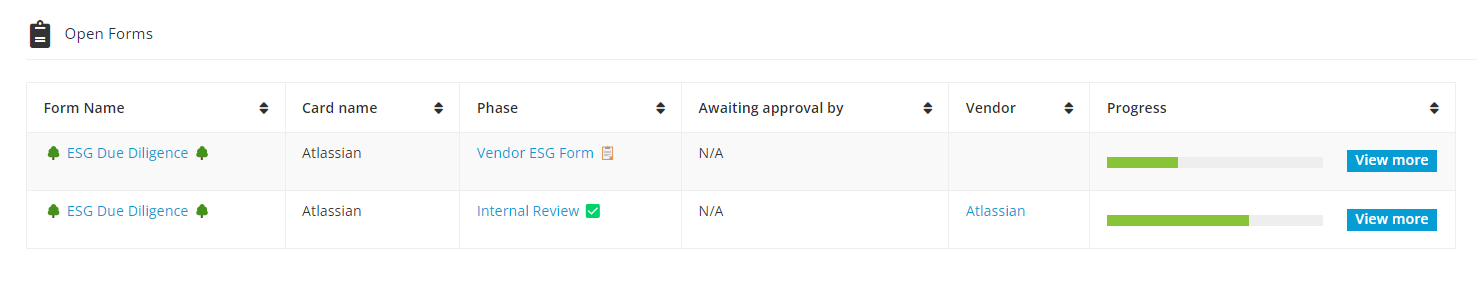
-
Open Forms: For each active workflow, the dashboard highlights any open forms that indicate a vendor's current involvement. This serves as a real-time indicator of vendor activity within a particular workflow.
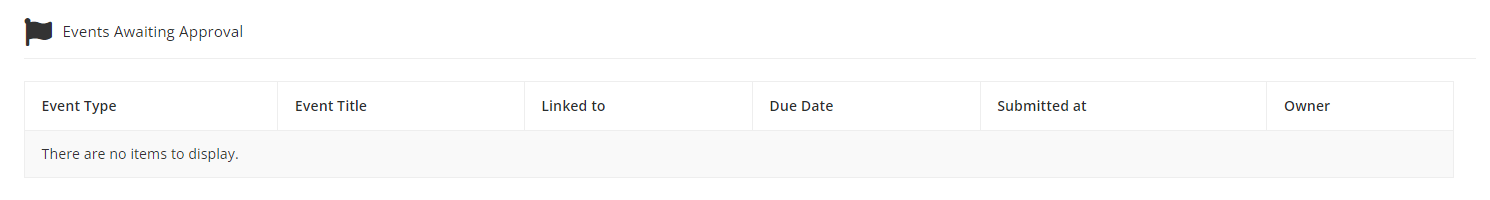
-
Pending Events: Lists events that are pending approval, ensuring you are aware of any critical actions that require their attention.
-
Vendor Messages: Displays messages sent by vendors, therefore enhancing communication between users and vendors.
The Employee Portal Dashboard
Required Permission - Employee Portal Module Administrator
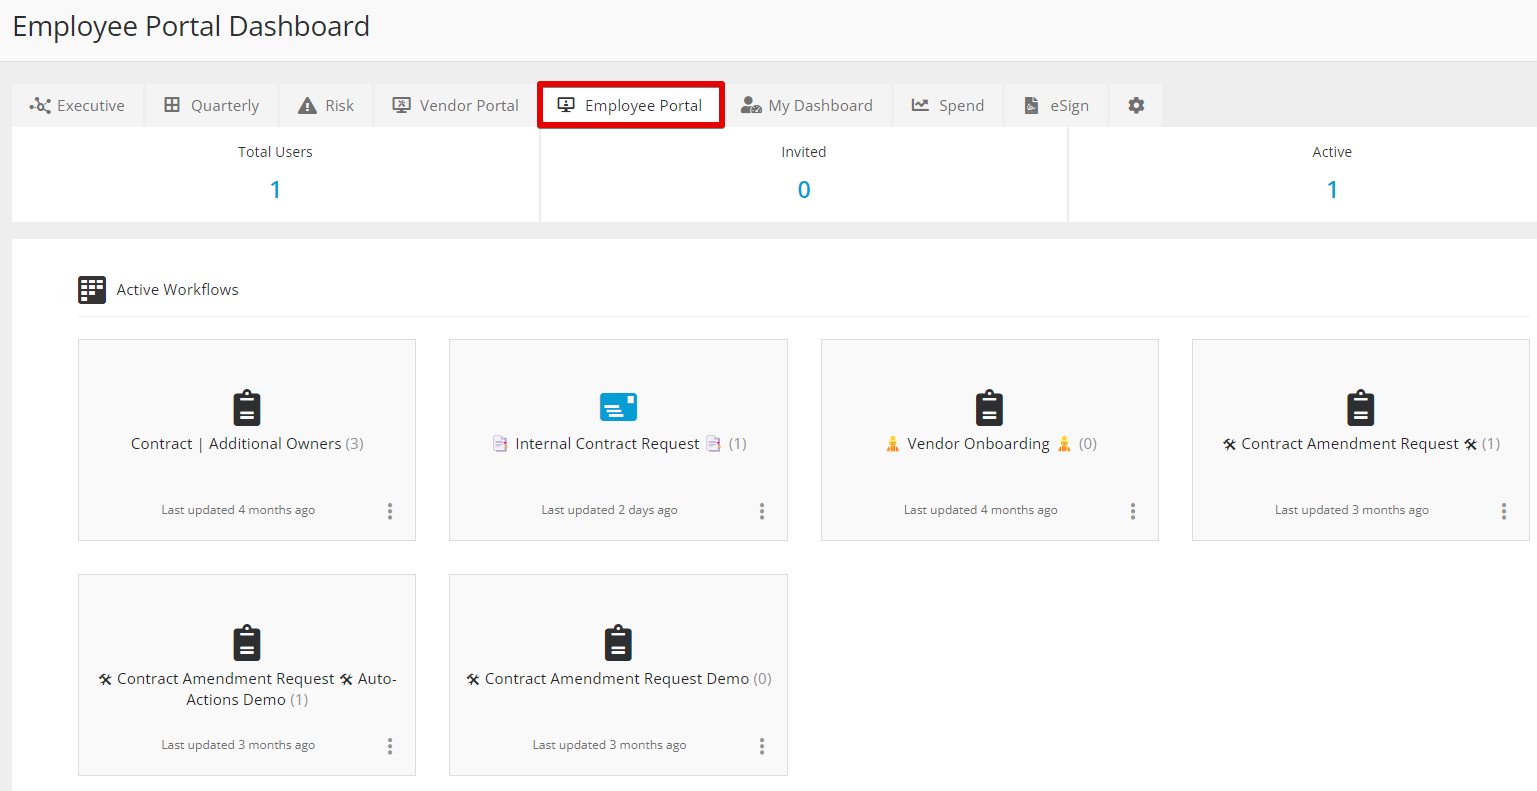
If your organisation uses the Employee Portal, the Employee Portal Dashboard provides an overview of colleague-related activities, enabling you to efficiently oversee and optimise internal processes.
Key features of the Employee Portal Dashboard include:
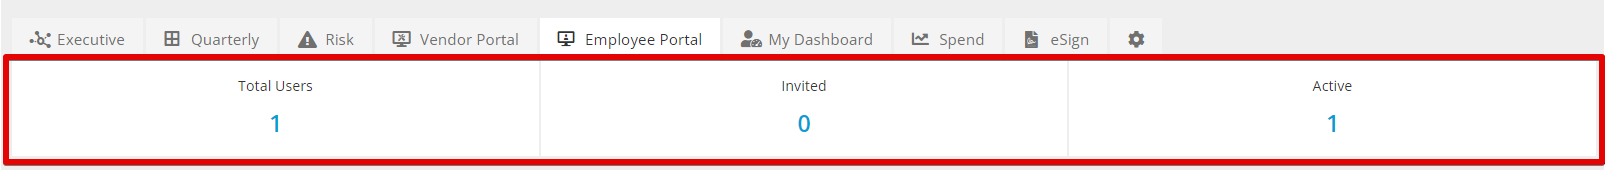
-
Employee Portal User Summaries: summarises colleagues who have been invited to the employee portal, categorising them based on their status as invited or active. This helps to monitor the real-time engagement of colleagues with the platform.
-
Active Workflows: Displays workflows that are active within the Employee Portal.
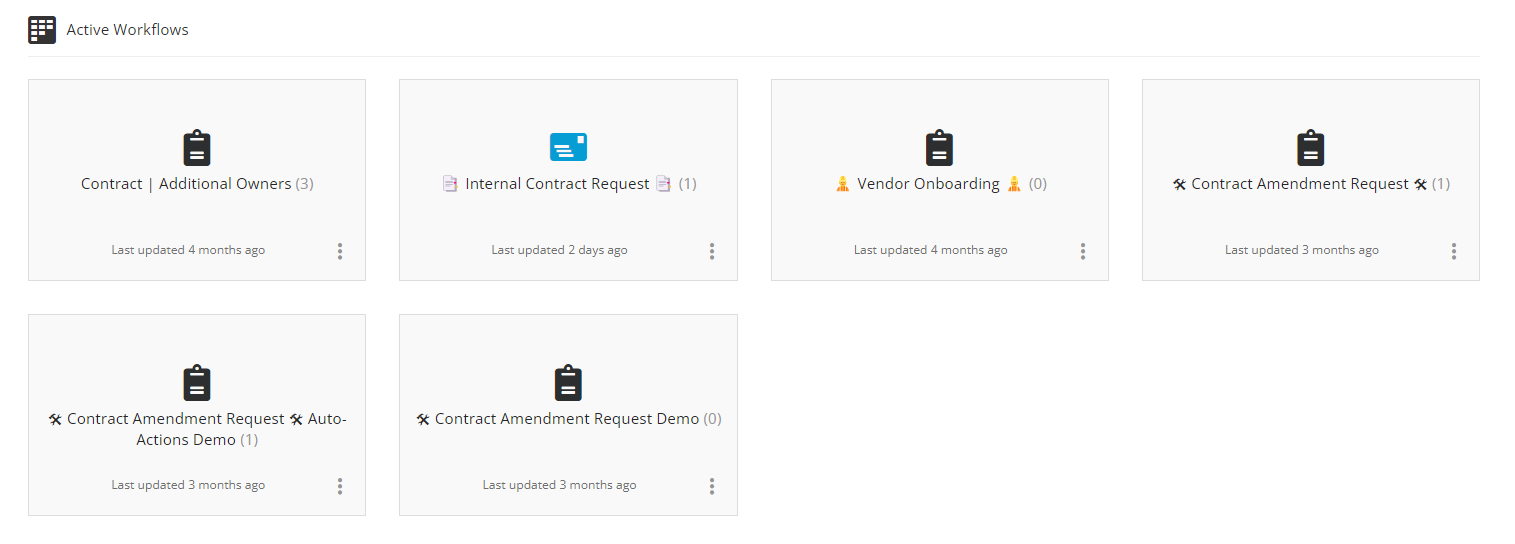
-
Open Forms: For each active workflow, the dashboard highlights any open forms created by your user. This feature indicates ongoing processes and actions within workflows, helping users stay informed about the various workflows within your tenant.

My Dashboard
Required Permission - N/A (Available to all users)
This offers a view of all actions relating to approvals, open forms, eNegotiations, and eSignatures. It also displays the total number of cards, allowing you to see all outstanding actions within Gatekeeper in one place.
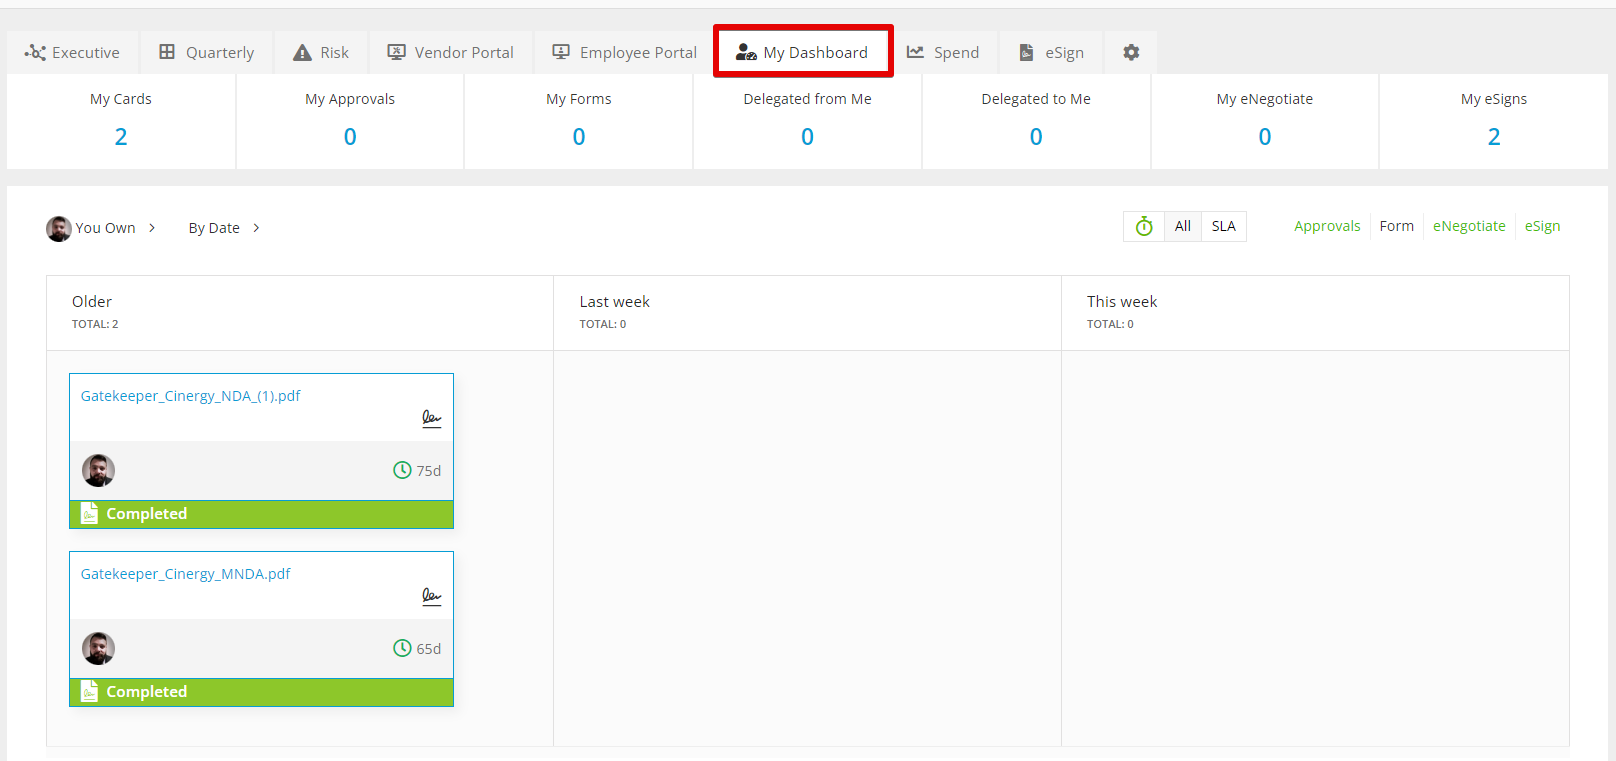
My Dashboard delivers a summarised view of all cards across all workflows:
- My Cards - the total number of cards the user has
- My Approvals - the total number of outstanding approvals the user has
- My Forms - the total number of cards the user raised through the submission of a form
- My eNegotiate - the cards the user owns of an eNegotiate phase
- My eSigns - the number of cards the user is assigned to as an eSign Signatory
Click directly on these counters to filter cards within the dashboard.
Note: Cards will also display in the My Dashboard area when generated automatically by a workflow trigger. These will appear with a user name of System Generated.
Click the card name to review more information, allowing you to:
- view a card summary
- reject and approve cards
- mark checklist items as done
- download contracts associated with a card
- cancel an eSign
- navigate to the workflow where the card is
- navigate to the form within the card
The Spend Dashboard
Required Permission - Global Administrator or Global Collaborator
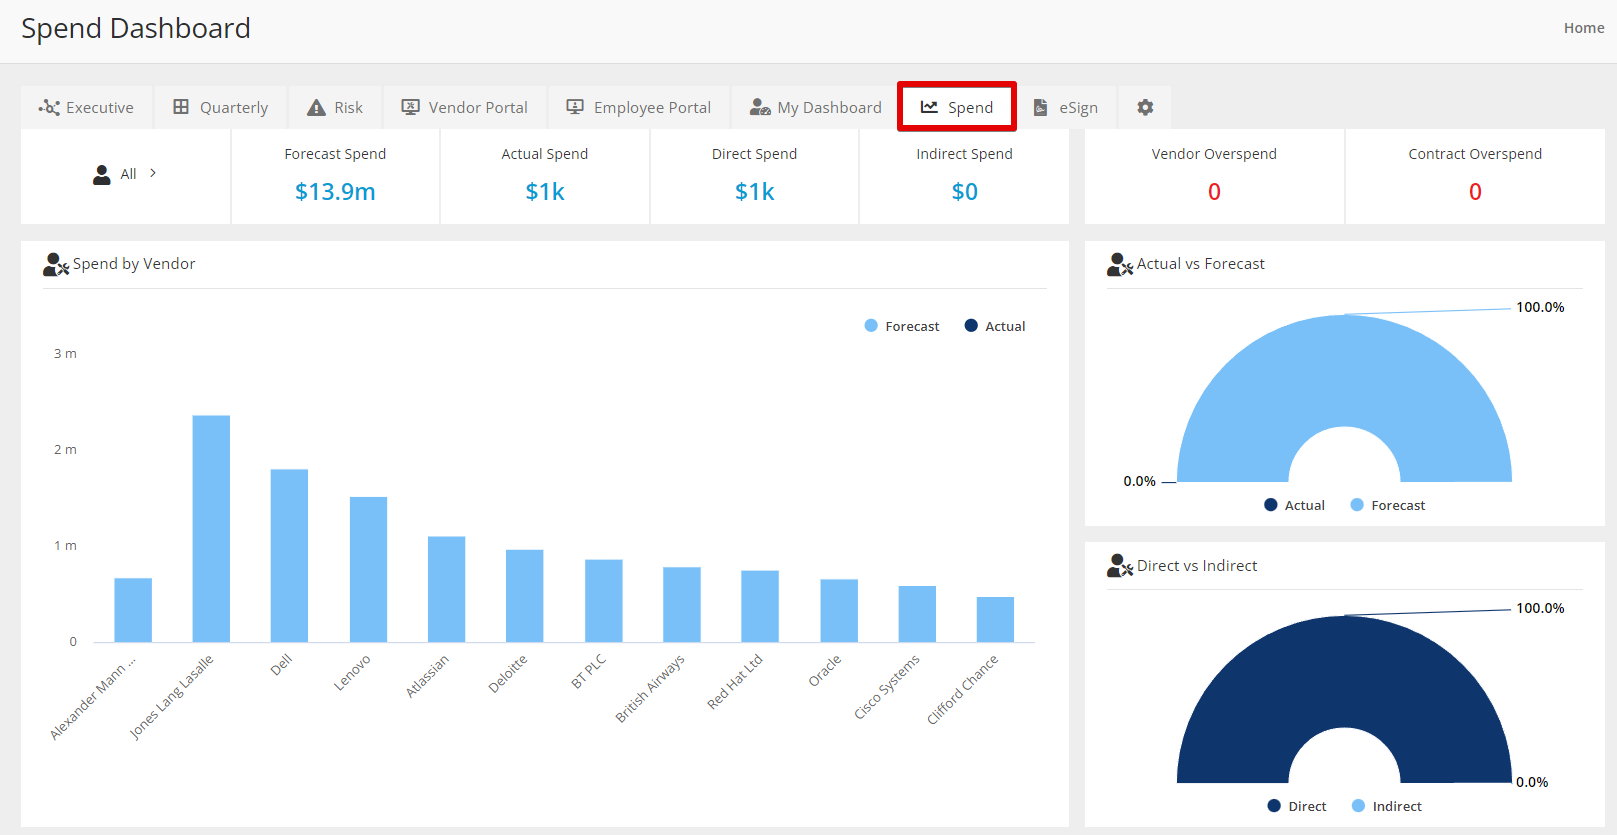
If your organisation uses the Spend Module, the Spend Dashboard provides several charts and KPIs. The Spend by Vendor chart includes any vendor with Actual spend (captured from each Live contract record as Annual Value within the 12-month date range). The Forecast vs. Actual spend is indicated through colour-coded bars. This chart is automatically generated from the aggregated spend information against each vendor.

Additionally, there are widgets which dissect the data in various ways, e.g. direct vs. indirect spend.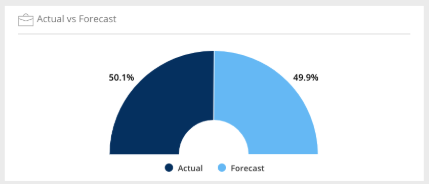
The eSign Dashboard
For the eSign Dashboard to be available, you must have Gatekeeper eSign enabled in your tenant. For more information, see Configure and Send Documents for eSign.
Required Permission - eSign Sender / eSign Signatory
This dashboard displays cards representing all your outstanding eSign actions in one place. This includes eSignatures you’ve requested or are a signatory of; it does not show eSigns that you are not involved in.
The eSign dashboard allows you to Filter by Access:
- You Sign - the cards you need to sign (waiting for your signature)
- You Requested - the cards you have requested to be signed
- All - All the cards you’ve requested or are a signatory for
You can also choose to view cards:
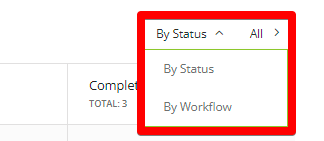
- By Status, e.g. Draft, Completed, Declined.
- By Workflow from which they originate
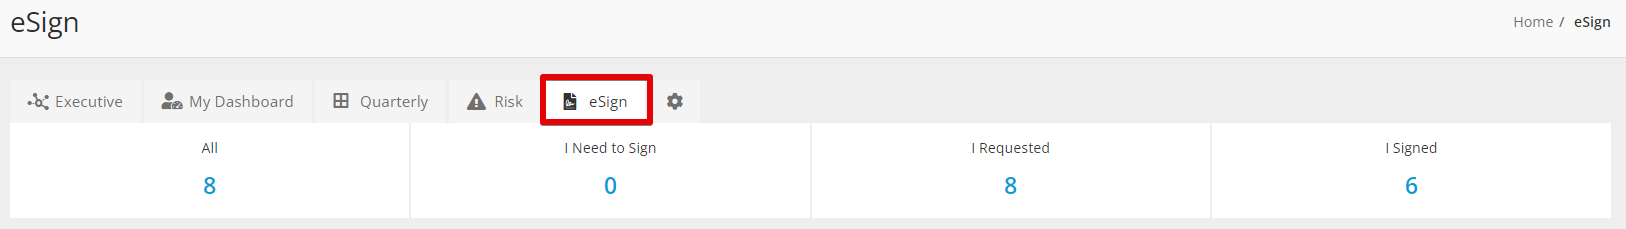
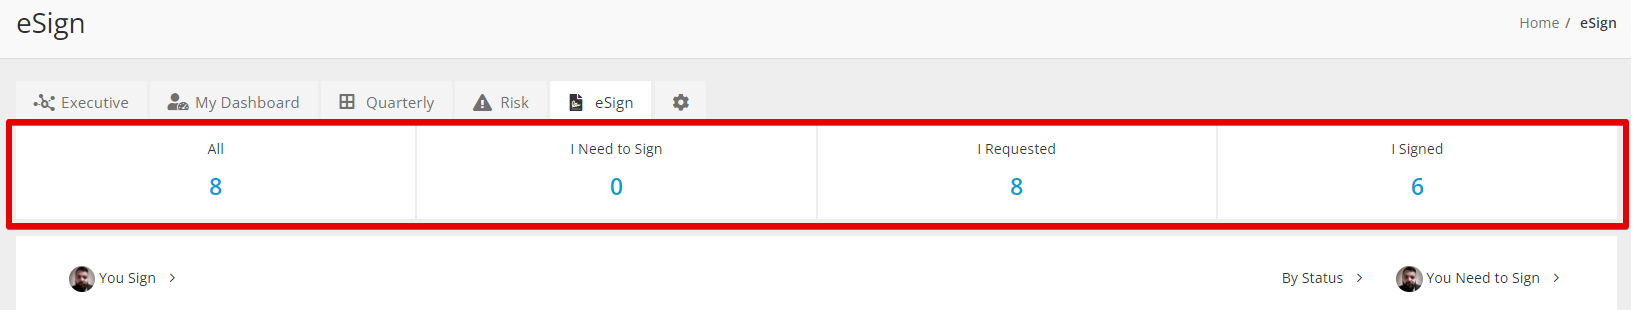
You can also click on the counters to filter cards within the dashboard:
- All - All your open eSign cards
- I Need to Sign - cards you are required to sign
- I Requested - eSign requests you have made
- I Signed - those that you have already completed
Teams, Categories and Entities Dashboards
For users who can view all contracts within a particular category/team/entity, Gatekeeper presents a dashboard view similar to the Executive Dashboard when opening up one of the records within the Vault.
Note: If a user can only see some of the contracts linked to a category/team/entity, they will not see a Dashboard tab when opening one of these records. For these users, the landing page will be the Data tab.
This provides additional ways to segment your data:
- Analysing at a category level is great for understanding your vendor base and identifying any duplications.
- Teams are a natural way of analysing data across the core functions of your business, such as IT, HR and Legal.
- Entities allow you to track the different obligations and budgets of your organisation when operating in different sectors/jurisdictions/countries.
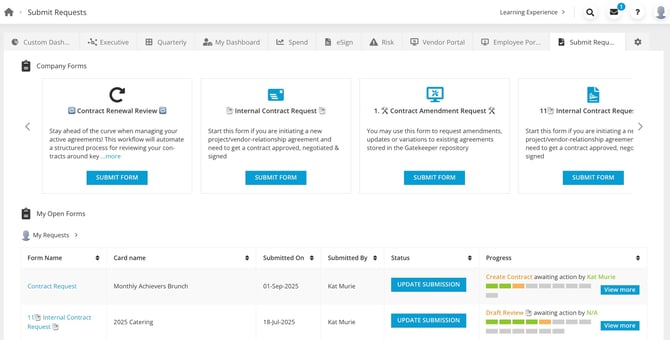
Submit Requests Dashboard
If your organisation uses the Employee Portal, the Submit Requests dashboard allows you to monitor any ongoing requests and initiate new form submissions in an instant.